9 Tools to Reduce Server Response Time
Does your website suffer from slow a response time?
Website speed is critical for both user experience and SEO in 2019.
In fact, Google has officially announced that page speed will be a ranking factor in the algorithm this year. The last thing you want is your customers giving up with a slow loading website and going to a competitor.
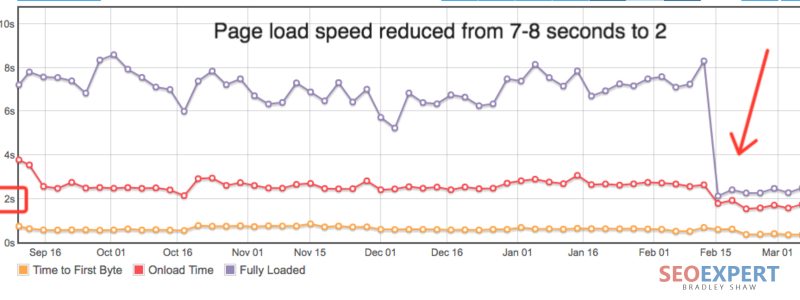
The time it takes for your site to load begins with “time to the first byte.” Fortunately, there are many online tools to measure a website’s performance. They can provide actionable information to decrease your time to the first byte and improve overall response time.
What is Server Response Time?
Server response time is the amount of time it takes for a web server to respond to a request from a browser. It measures how long it takes to load the necessary HTML to begin rendering the page from your server, subtracting out the network latency between Google and your server. It adds to the total website loading time.
Time to first byte (TTFB) is a measurement used as an indication of the responsiveness of a web server or other network resource. TTFB measures the duration from the user or client making an HTTP request to the first byte of the page being received by the client’s browser.
Ways to Reduce Server Response Times
There are four primary ways to reduce the amount of time it takes a web server to respond to a request:
- Optimize existing resources: Optimize your images by adequately compressing them. Optimize your database. The more efficient a database query, the faster will be the response time of a dynamic website or application.
- Eliminate render-blocking JavaScript and CSS in above-the-fold content.
- Upgrade your server resources: Cheap hosts are useful for when you are starting. However, as your business grows, I suggest going with a managed or cloud hosting and backup solution.
- Use a Content Delivery Network or CDN: A content delivery network (CDN) is a system of distributed servers (network) that deliver pages and other Web content to a user, based on the geographic locations of the user, the location of the web page and the content delivery server.
Which factors affect the load time of a website?
- Third-party plugins, minimize your use of plugins on WordPress.
- Remove render blocking javascript
- Java and CCS components
- Leverage browser caching
- The number of items on the website itself, can any be eliminated?
- Server optimization
- Are you using a content delivery network?
What is a Good Server Response Time?
Response times are measured in milliseconds, ms.
A good server response time will be lower than 200ms and should be consistent across multiple users. A response time above 200 ms, or extreme variations, are both signs that something needs to be fixed.
Time to the first byte is another way to measure speed, by timing how long it takes for a server to respond to a search for the page via the URL bar.
Why does Time to First Byte matter for SEO?
Customer satisfaction and server speed are both factors that go into your site’s SEO rank. For major search engines like Google, speed matters. Google created the 200ms rule for web servers because most people will give up on a website if it does not load within three seconds.
Google has recently announced that they will also be making page speed a ranking factor, based on the mobile version of your website.
It has been shown that mobile searches account for sixty percent of all search traffic in the United States.
Those mobile phone searchers are going to be on their smartphones, trying to reach a website, and likely to give up and go elsewhere if it does not load quickly enough.
User Experience is an essential element of search engine optimization.
If a customer is becomes engaged interested in a product or service, then the website stops loading or slows, their buying impulse will also take a plunge.
Tools to Test Server Response and Time to First Byte
The best tools all have a few aspects in common.
They should tell you:
- Number of items to load on your page
- How long each request takes, including database lookups.
- Final load time from start to finish
- And specific tips to improve your issues
Personally, I prefer tools that display a waterfall style chart.
The waterfall chart gives you a graphic of how each aspect measures up so you can quickly see where the problem is and act upon it.
GTMetrix
GTMetrix ranks your website and scores it using both Google and Yahoo grading metrics. You can look at the scorecard or request a waterfall chart to analyze the results. The waterfall analysis is my go to server response time checker.
Its default location is Canadian, but you can also register for free to see results from Dallas TX, Hong Kong, London, Mumbai, Sao Paulo and Sydney. That way, you can compare how your visitor in different regions might be viewing your site.
KeyCDN Website Speed Test
KeyCDN is a speed test that works well on mobile devices, so it gives a more precise read on how your mobile clients might be viewing your site
It tests from one of 14 chosen locations around the world and sends you the results either privately or publicly. You can view key metrics, a waterfall chart, and a website preview.
Pingdom
Pingdom speed test is one of the better-known website tools to check website speed. In fact, I use it to monitor all of my client’s hosts and websites 24/7.
The analysis page gives a general overview based on the most common categories and statistics. It lets you quickly compare CDN or content delivery network, page asset size, queries per page, etc.
Once you have the information, you can start to optimize accordingly and make your website faster.
Google Page Speed Insights Speed Test
Google PageSpeed Insights comes from Google itself.
The grades are on a scale of 1-100, with anything above 85 being good. It divides the load times between above the fold and full page, so users can assess any differences and find ways to bring the two numbers closer together.
The User Experience category gives additional insights on customer satisfaction, telling how an objective viewer would experience the configuration, buttons, and font sizes.
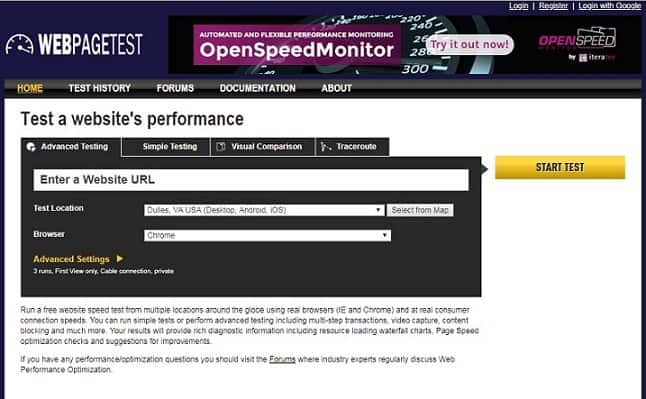
WebPage Test
WebPage Test is unique in that it allows you to search through the response time in over forty cities and twenty-five browsers, including mobile browsers.
Varvy Pagespeed Optimization
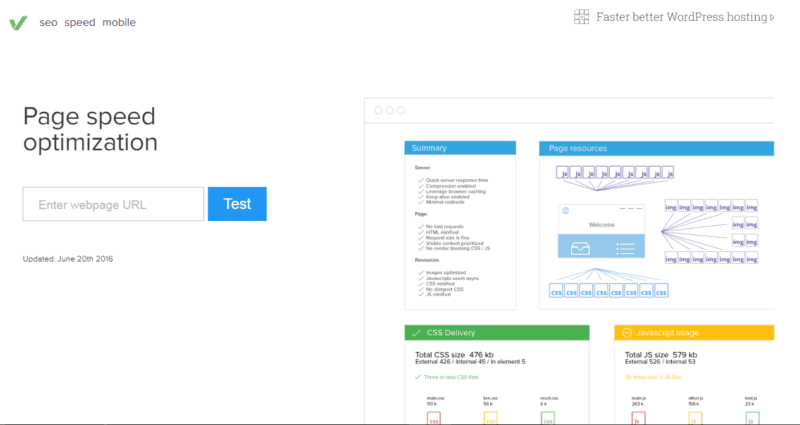
Varvy Pagespeed Optimization shares a creator with Moz Local. Each report generates information on five different topics: diagrams, CSS and Javascript delivery, page speed issues, and the services used.
This is a graphic-centered reporting tool, best for those who like to use visuals in diagnosing and solving problems. Newcomers can gain valuable insights via the tutorials on everything from SEO rank to browser caching.
Site Relic
Site Relic works on both desktop and mobile devices. It provides the essential metrics and information on how to resolve IP address issues.
Its setup is intuitive and easy to use but is slightly limited in the number of cities and locations.
dotcom-monitor
Dotcom-monitor’s most popular feature is it can run multiple geographic tests at the same time, which gives more results faster.
Yellow Lab Tools
Yellow Lab tests your host using many factors
One unique tool is its assessment of how JavaScript interacts with the DOM during site loading and generates a quick viewgraph to point out any errors.
Afterward, it gives a global score based on that factor and five other key categories.
Tactics to improve server response time, no one simple fix
Like a busy restaurant handling many large dinner parties at once, service will inevitably slow down as it tries to manage everything at once.
By using external caches, you can transfer some of the work from the back end to the front to balance the workload.
Another is the “keep alive” method, which allows the HTML to carry more than one element per request, like a waiter carrying two trays instead of one.
Other items such as pictures, can be deferred until after the bulk of the web page has loaded, which is a useful trick if your site is graphics heavy or if you are loading a blog post with many images.
Customizing server settings can improve performance as default settings are not one size fits all. Websites with Java and CSS scripts are sometimes coded for each element to be fetched in separate files. By allowing them to be transmitted in a single file will improve web server response.


